Note
Go to the end to download the full example code. or to run this example in your browser via Binder
普通最小二乘法和岭回归方差#
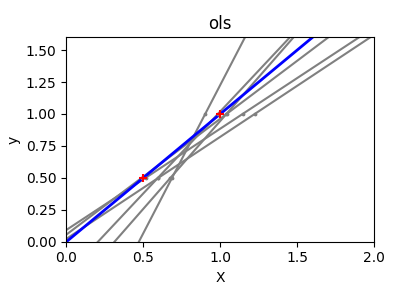
由于每个维度中的点很少,以及线性回归使用直线尽可能地跟随这些点,观测值上的噪声将导致很大的方差,如第一个图所示。由于观测值中引入的噪声,每条线的斜率在每次预测时可能会有很大的变化。
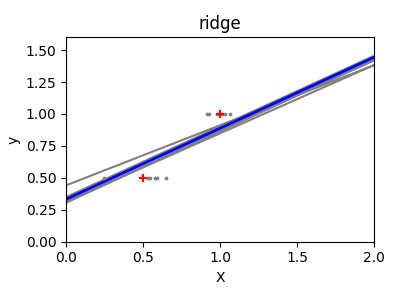
岭回归基本上是最小化一个带惩罚的最小二乘函数。惩罚会“缩小”回归系数的值。尽管每个维度中的数据点很少,但与标准线性回归相比,预测的斜率更加稳定,线本身的方差大大减少。
# 代码来源:Gaël Varoquaux
# 由Jaques Grobler修改用于文档
# SPDX许可证标识符:BSD-3-Clause


import matplotlib.pyplot as plt
import numpy as np

from sklearn import linear_model

X_train = np.c_[0.5, 1].T
y_train = [0.5, 1]
X_test = np.c_[0, 2].T

np.random.seed(0)

classifiers = dict(
    ols=linear_model.LinearRegression(), ridge=linear_model.Ridge(alpha=0.1)
)

for name, clf in classifiers.items():
    fig, ax = plt.subplots(figsize=(4, 3))

    for _ in range(6):
        this_X = 0.1 * np.random.normal(size=(2, 1)) + X_train
        clf.fit(this_X, y_train)

        ax.plot(X_test, clf.predict(X_test), color="gray")
        ax.scatter(this_X, y_train, s=3, c="gray", marker="o", zorder=10)

    clf.fit(X_train, y_train)
    ax.plot(X_test, clf.predict(X_test), linewidth=2, color="blue")
    ax.scatter(X_train, y_train, s=30, c="red", marker="+", zorder=10)

    ax.set_title(name)
    ax.set_xlim(0, 2)
    ax.set_ylim((0, 1.6))
    ax.set_xlabel("X")
    ax.set_ylabel("y")

    fig.tight_layout()

plt.show()
Total running time of the script: (0 minutes 0.113 seconds)
Related examples

