Note
Go to the end to download the full example code. or to run this example in your browser via Binder
流水线:将PCA和逻辑回归连接起来#
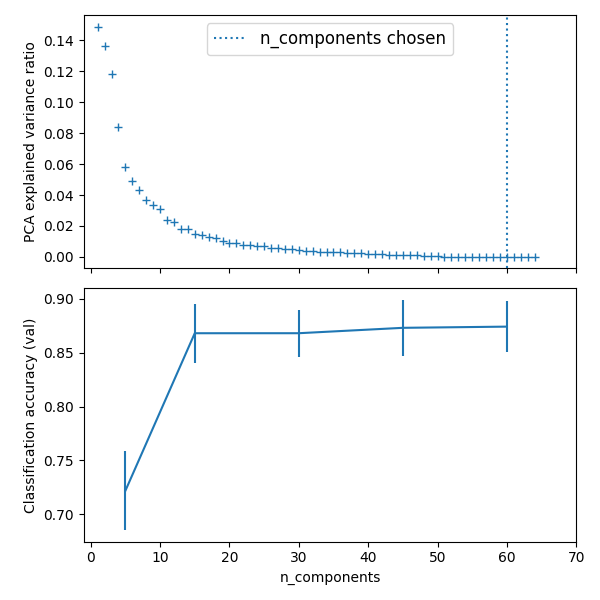
PCA进行无监督的降维,而逻辑回归进行预测。
我们使用GridSearchCV来设置PCA的维度

Best parameter (CV score=0.874):
{'logistic__C': np.float64(21.54434690031882), 'pca__n_components': 60}
# 代码来源:Gaël Varoquaux
# 由Jaques Grobler修改用于文档
# SPDX许可证标识符:BSD-3-Clause

import matplotlib.pyplot as plt
import numpy as np
import polars as pl

from sklearn import datasets
from sklearn.decomposition import PCA
from sklearn.linear_model import LogisticRegression
from sklearn.model_selection import GridSearchCV
from sklearn.pipeline import Pipeline
from sklearn.preprocessing import StandardScaler

# 定义一个管道以搜索PCA截断和分类器正则化的最佳组合。
pca = PCA()
# 定义一个标准缩放器以规范化输入
scaler = StandardScaler()

# 将容差设置为较大值以加快示例速度
logistic = LogisticRegression(max_iter=10000, tol=0.1)
pipe = Pipeline(steps=[("scaler", scaler), ("pca", pca), ("logistic", logistic)])

X_digits, y_digits = datasets.load_digits(return_X_y=True)
# 可以使用 '__' 分隔的参数名称来设置管道的参数:
param_grid = {
    "pca__n_components": [5, 15, 30, 45, 60],
    "logistic__C": np.logspace(-4, 4, 4),
}
search = GridSearchCV(pipe, param_grid, n_jobs=2)
search.fit(X_digits, y_digits)
print("Best parameter (CV score=%0.3f):" % search.best_score_)
print(search.best_params_)

# Plot the PCA spectrum
pca.fit(X_digits)

fig, (ax0, ax1) = plt.subplots(nrows=2, sharex=True, figsize=(6, 6))
ax0.plot(
    np.arange(1, pca.n_components_ + 1), pca.explained_variance_ratio_, "+", linewidth=2
)
ax0.set_ylabel("PCA explained variance ratio")

ax0.axvline(
    search.best_estimator_.named_steps["pca"].n_components,
    linestyle=":",
    label="n_components chosen",
)
ax0.legend(prop=dict(size=12))

# 对于每个组件数量,找到最佳分类器结果
components_col = "param_pca__n_components"
is_max_test_score = pl.col("mean_test_score") == pl.col("mean_test_score").max()
best_clfs = (
    pl.LazyFrame(search.cv_results_)
    .filter(is_max_test_score.over(components_col))
    .unique(components_col)
    .sort(components_col)
    .collect()
)
ax1.errorbar(
    best_clfs[components_col],
    best_clfs["mean_test_score"],
    yerr=best_clfs["std_test_score"],
)
ax1.set_ylabel("Classification accuracy (val)")
ax1.set_xlabel("n_components")

plt.xlim(-1, 70)

plt.tight_layout()
plt.show()
Total running time of the script: (0 minutes 0.662 seconds)
Related examples


