Note
Go to the end to download the full example code. or to run this example in your browser via Binder
数字数据集#
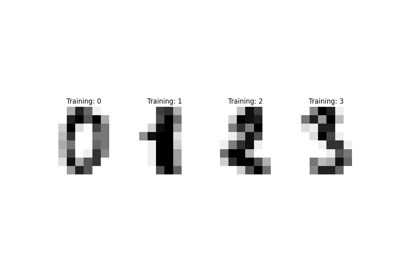
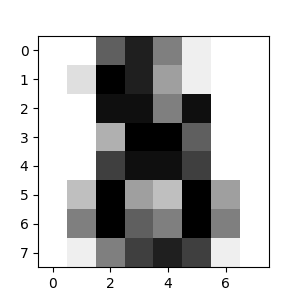
该数据集由1797个8x8的图像组成。每个图像,如下所示,是一个手写数字。 为了使用这样的8x8图像,我们必须首先将其转换为长度为64的特征向量。
有关此数据集的更多信息,请参见 此处 。
# 代码来源:Gaël Varoquaux
# 由Jaques Grobler修改用于文档
# SPDX许可证标识符:BSD-3-Clause

import matplotlib.pyplot as plt

from sklearn import datasets

# 加载数字数据集
digits = datasets.load_digits()

# 显示最后一位数字
plt.figure(1, figsize=(3, 3))
plt.imshow(digits.images[-1], cmap=plt.cm.gray_r, interpolation="nearest")
plt.show()
Total running time of the script: (0 minutes 0.038 seconds)
Related examples

